Ideal University Life: A Statistical Analysis and Prediction
A statistical analysis and neural network used to analyze and predict student satisfaction and stress levels
Motivation
As I'm writing this I'm preparing to apply to colleges. I've recieved a lot of advice that it makes much more of a difference in how you approach college than which college you go to. Coming from a small town where there isn't much opportunity, I wanted to look into the best ways I can make the most of my college experience. I decided to look into the data and see what I could find.
Key Research Questions
- What leads to the most optimal student college experience?
- What are the most important factors in student satisfaction and stress levels?
- Can we predict student satisfaction and stress levels?
Dataset
The dataset I used was a survey conducted by the National University of Singapore. The survey was conducted in 2019 and had around 3,000 responses. The survey asked questions about the students' demographics, their satisfaction with their student life, and their stress levels. The survey also asked questions about their involvement in the university community. The survey was conducted in order to help the university better understand their students and improve their experience. Here is the dataset
Data Exploratory Analysis
First things first I wanted to get an overview of the distrubution of the data and the features we are using. There are a total of 18 features in the dataset.
 0   Career                                                    2958 non-null   str
 1   Citizenship                                               2958 non-null   str
 2   Nationality                                               2958 non-null   str
 3   Year since Matriculation                                  2958 non-null   int64
 4   Year of Study                                             2958 non-null   int64
 5   Primary Programme                                         2958 non-null   str
 6   Gender                                                    2958 non-null   str
 7   Department                                                2958 non-null   str
 8   Housing Type                                              2958 non-null   str
 9   Q1-How many events have you Volunteered in ?              2958 non-null   int64
 10  Q2-How many events have you Participated in ?             2958 non-null   int64
 11  Q3-How many activities are you Interested in ?            2958 non-null   int64
 12  Q4-How many activities are you Passionate about ?         2958 non-null   int64
 13  Q5-What are your levels of stress ?                       2958 non-null   int64
 14  Q6-How Satisfied You are with your Student Life ?         2958 non-null   int64
 15  Q7-How much effort do you make to interact with others ?  2940 non-null   float64
 16  Q8-About How events are you aware about ?                 2940 non-null   float64
 17  response_id                                               2958 non-null   int64
 18  Q9-What is an ideal student life ?                        2371 non-null   str
Out of the box we have some missing data to take care of. We can fill these values with null values. We can also see that the data is a mix of categorical and numerical data. We will need to preprocess the data later in order to use it in our model.
Metrics
The first thing I wanted to look at was the distribution of the data. I wanted to see if there were any features that were heavily skewed or had a lot of outliers. I also wanted to see if there were any features that were correlated with each other. Here are the base metrics for some of the features. To see all of the metrics, look in the GitHub repository.
Q4-How many activities are you Passionate about ?
count                                        2958.000000
mean                                            3.184246
std                                             1.969894
min                                             0.000000
25%                                             2.000000
50%                                             3.000000
75%                                             4.000000
max                                            11.000000

Q5-What are your levels of stress ?
count                          2958.000000
mean                              3.091954
std                               1.653537
min                               0.000000
25%                               2.000000
50%                               3.000000
75%                               4.000000
max                               9.000000

Q6-How Satisfied You are with your Student Life ?
count                                        2958.000000
mean                                            1.925287
std                                             0.562162
min                                             0.000000
25%                                             2.000000
50%                                             2.000000
75%                                             2.000000
max                                             3.000000

...
Distributions
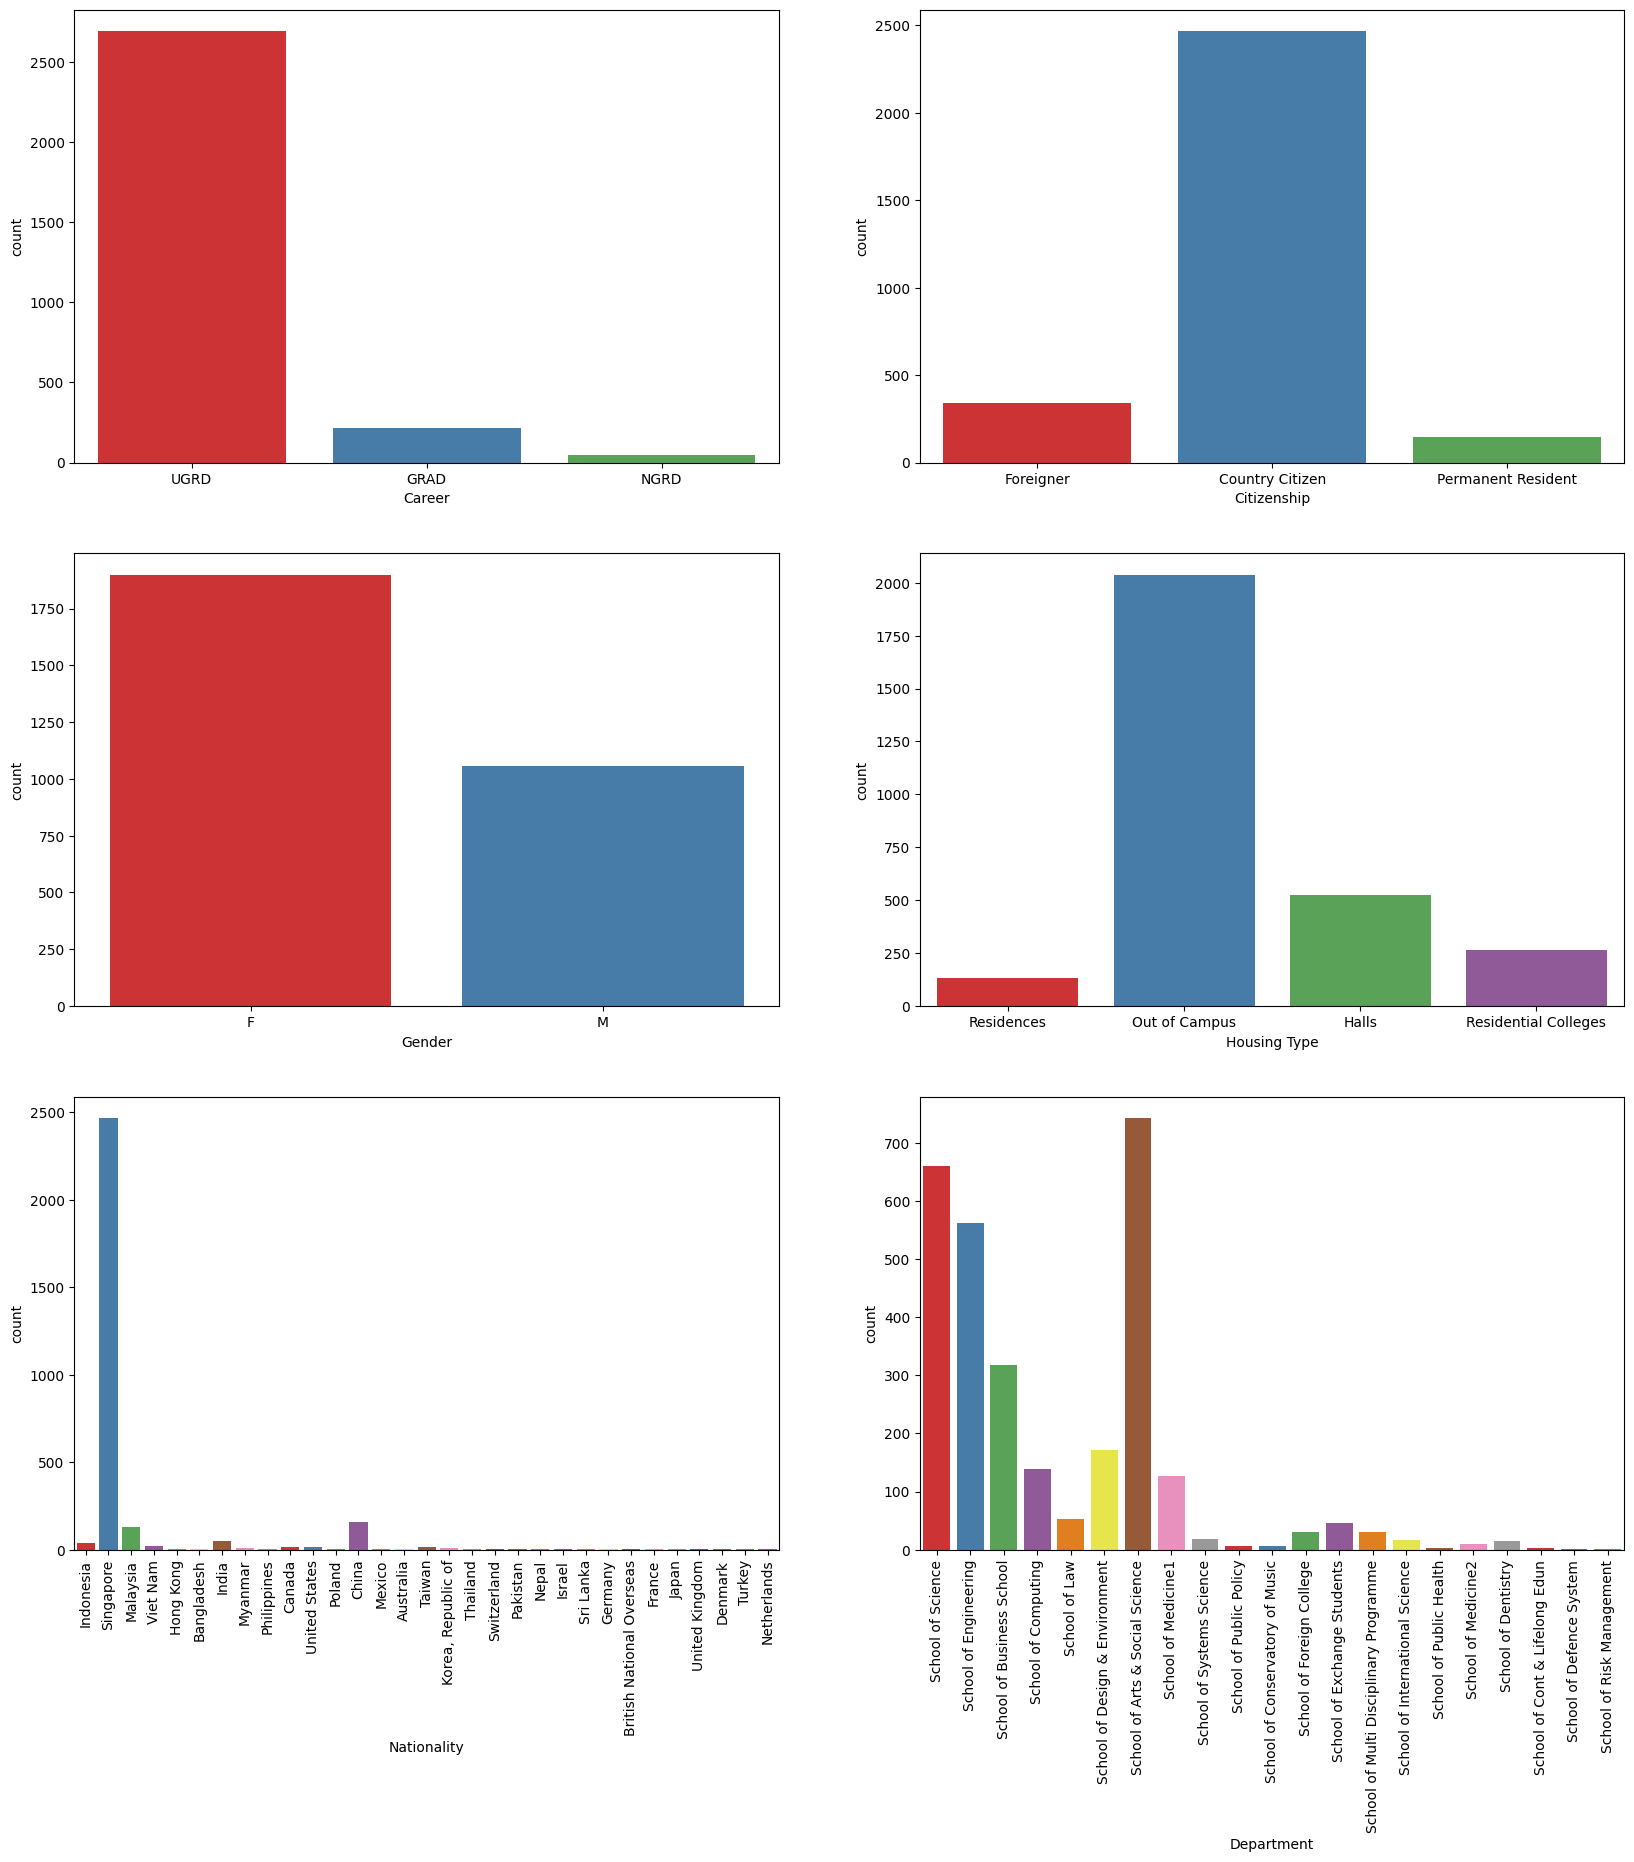
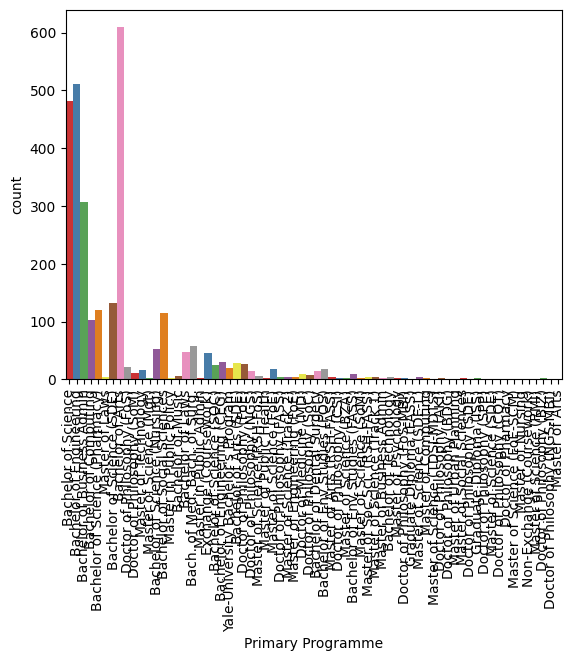
The raw numbers are great but a visual representation is much more helpful. Here are the distributions of some of the features. To see all of the distributions, look in the GitHub repository. First up are the categorical features, displayed in a countplot.
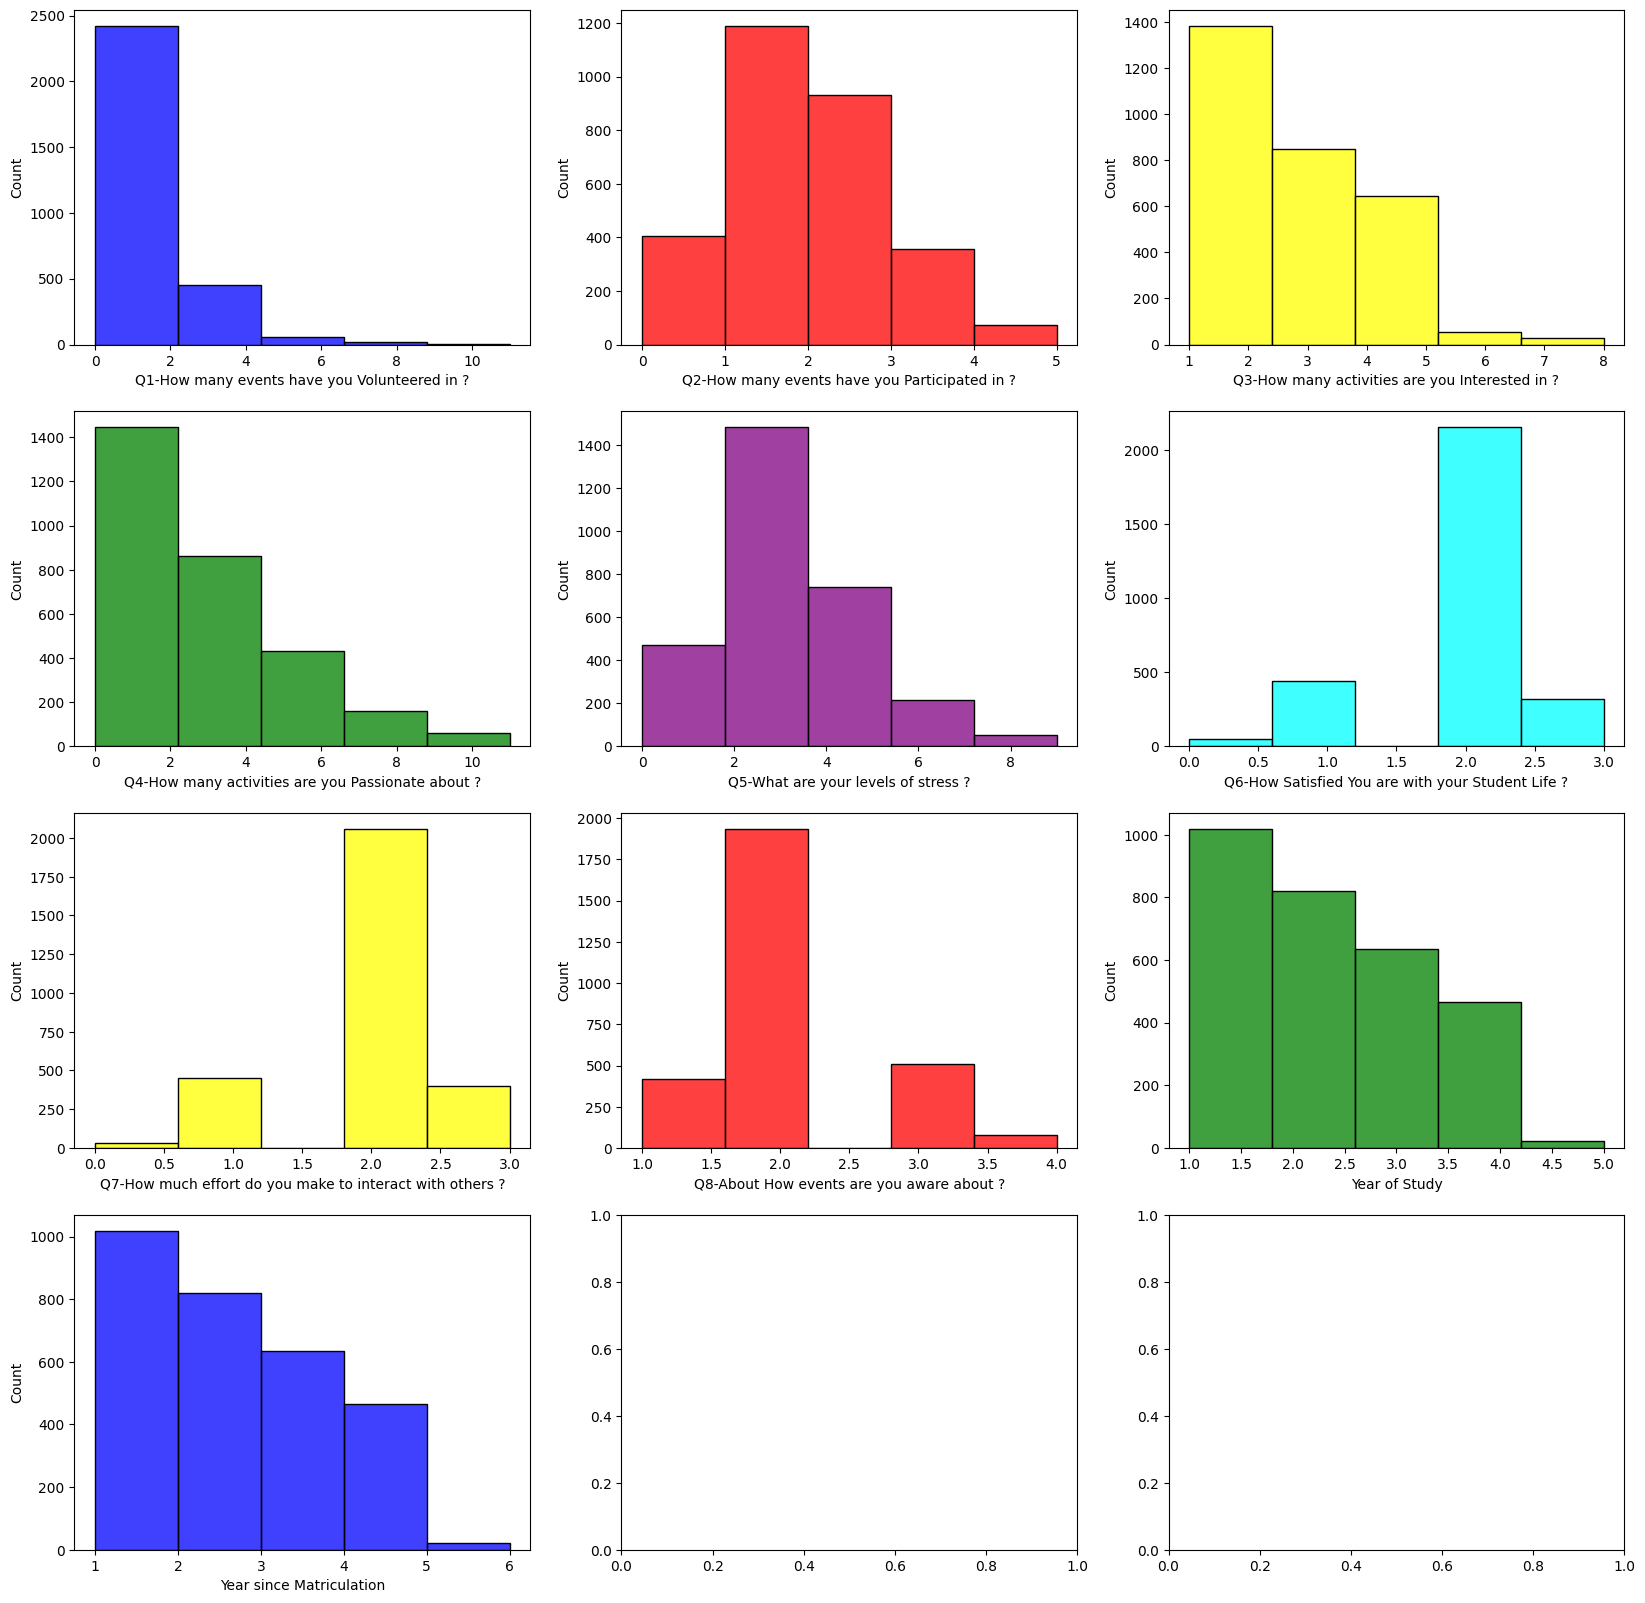
Next up are the numerical features, displayed in a histogram.
Through these graphs we can see that there are some features that are heavily skewed. Many students are disproportionate from singapore and located out of campus. School of Arts and Social Sciences is the largest with School of Science following. Vast majority of students analyzed were in their undergraduate. We can also see that there are some features that have a some outliers. We will need to preprocess the data in order to use it in our model.
We also see in many of the numerical features that most are skewed distributions. This is expected for many of the activities as most students are not involved in many activities. The stress feature is relatively normally distributed. The satisfaction feature is split between two values. This is expected as the survey asked students to rate their satisfaction on a scale of 0-3.
Correlations
Next I wanted to see if there were any features that were correlated with each other. I used a heatmap to visualize the correlations between the features.
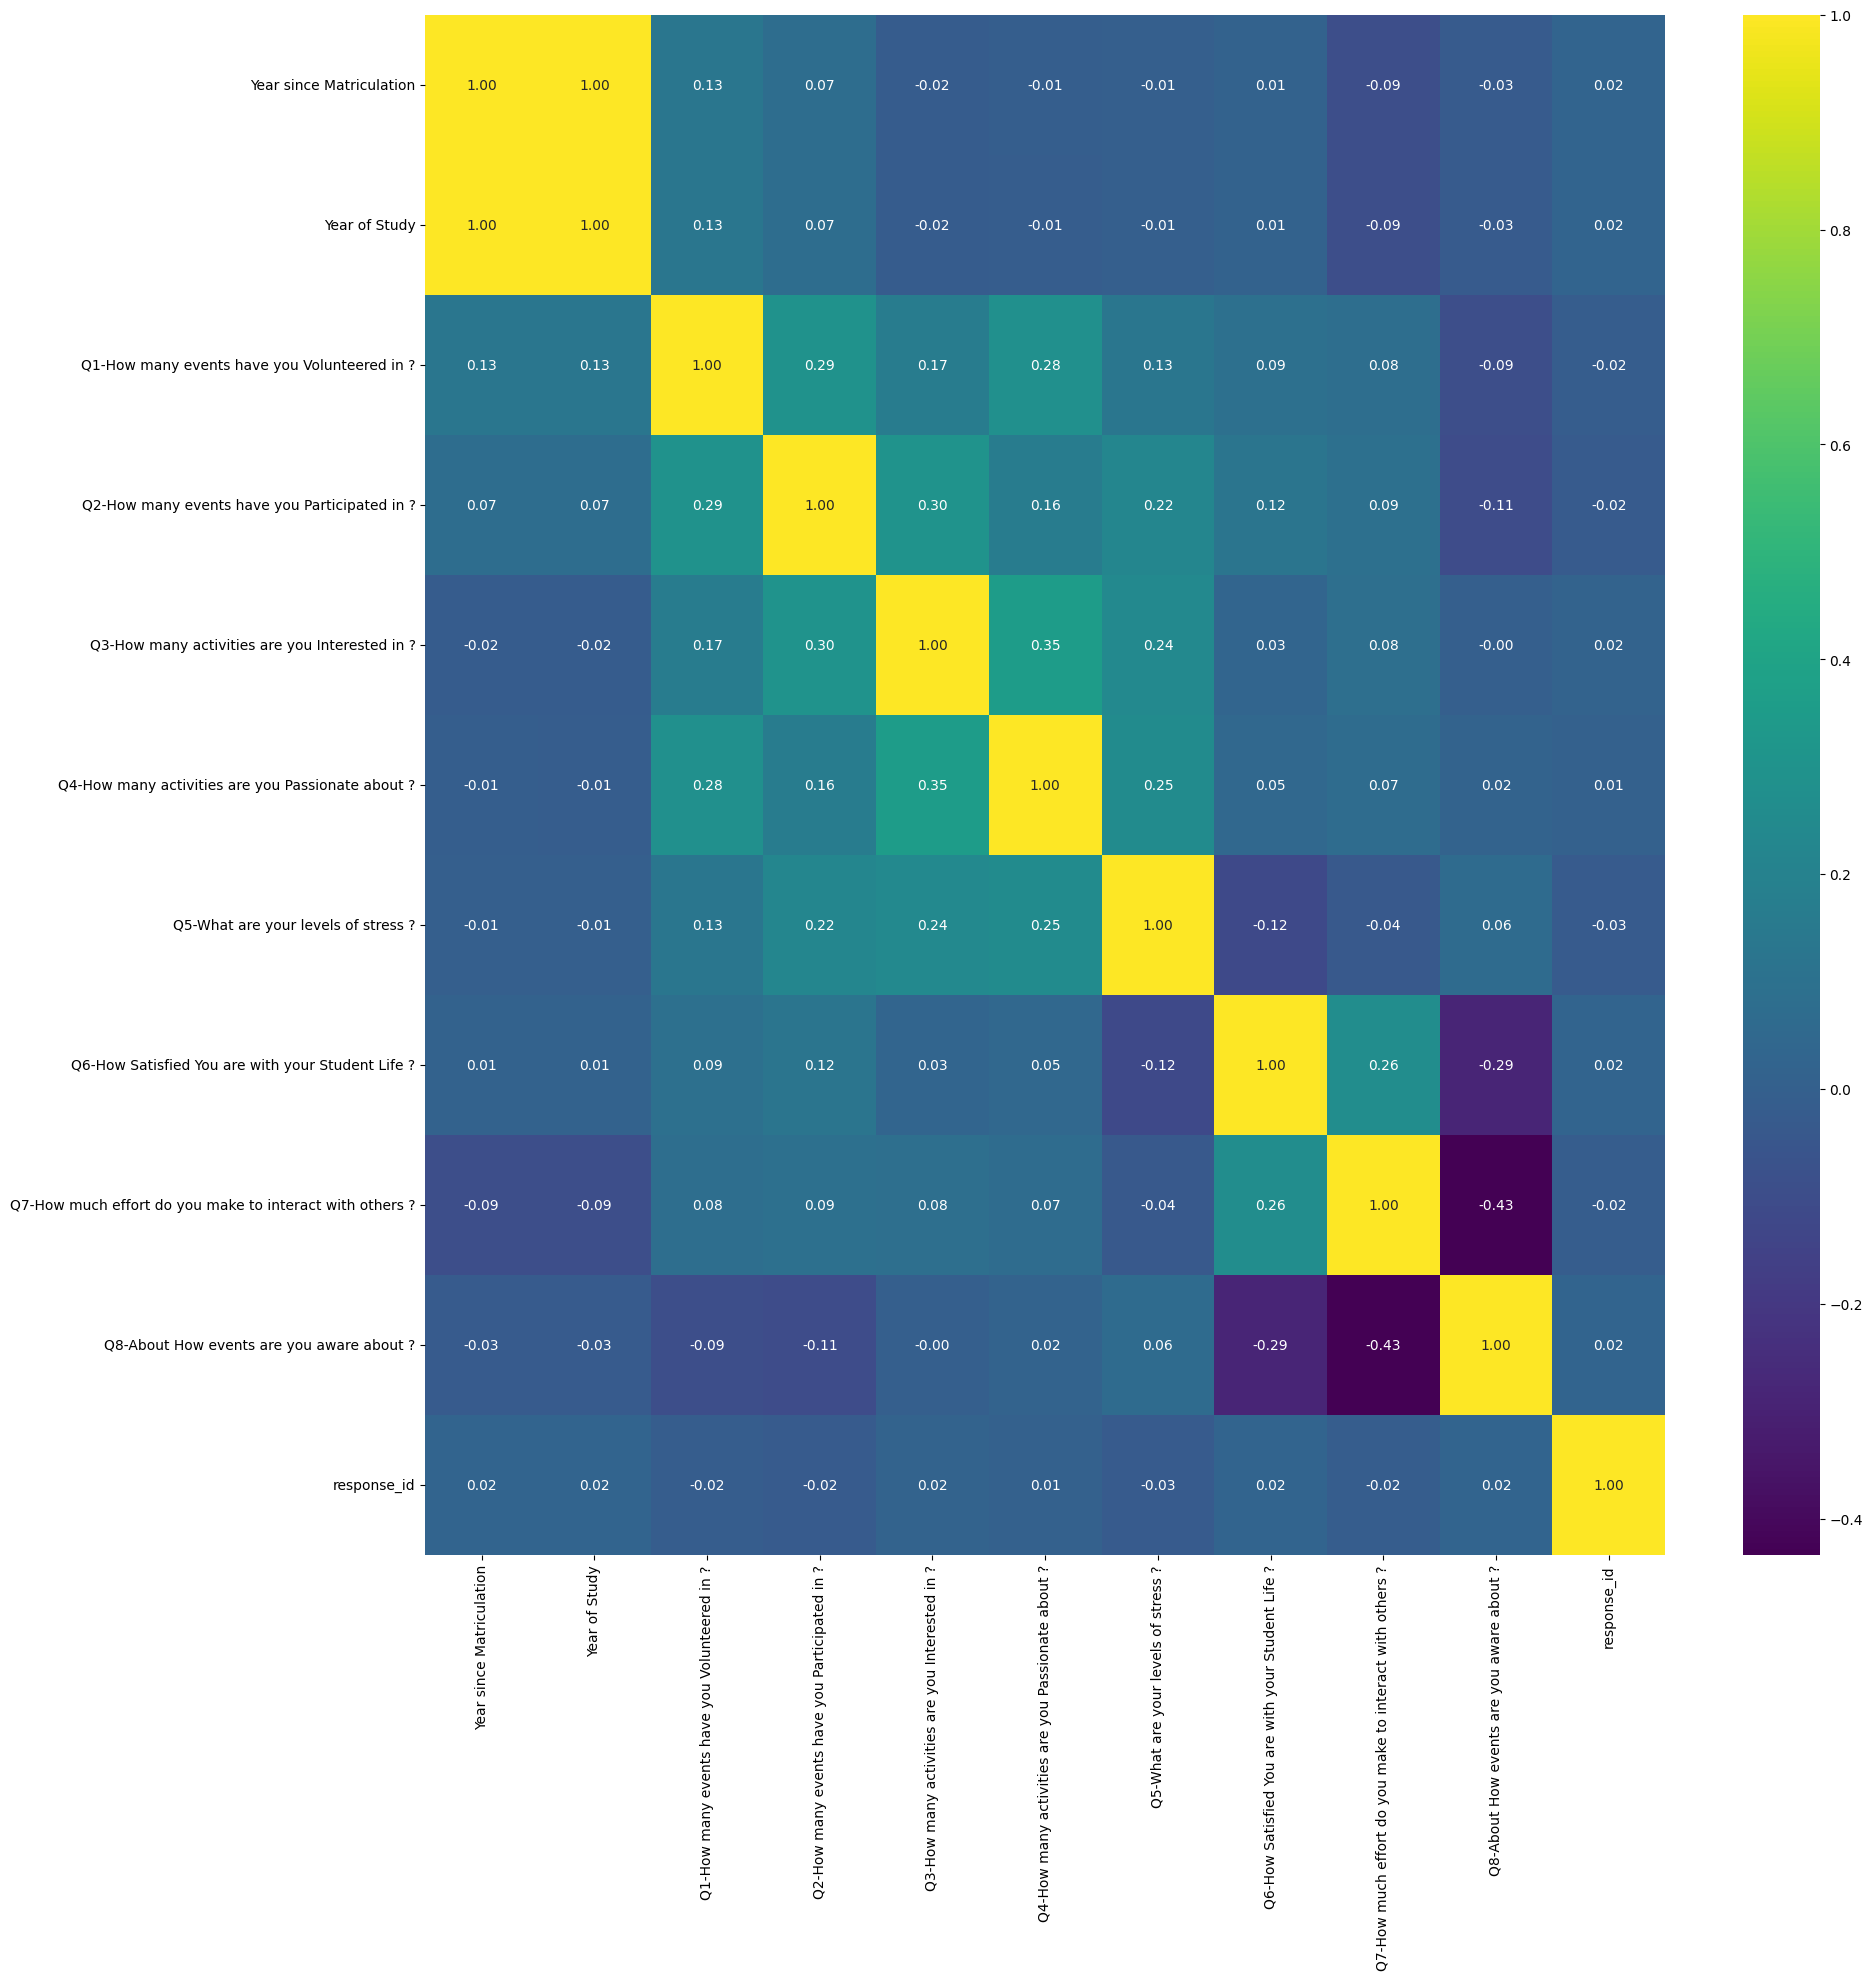
The strongest correlated features were the activities features. This is expected as students who are involved in more activities are more likely to be involved in more activities. There is also a positive correlation among features related to participation. This is expected as students who seek more opportunities will be more likely to participate in more events. There is also a positive correlation between the participation features and the stress feature. This is also expected as students who participate in more events are more likely to be stressed.
Notably there was a strong negative correlation between awareness of events and how much effort do you make to interact with others. This is interesting as it shows that students who are more aware of events are less likely to interact with others. This could be because students who are more aware of events are more likely to be involved in more events. This could lead to less time to interact with others as they are busy with events. Additionally, students who are more aware of events are more likely to be stressed. This could also lead to less time to interact with others as they are busy with events.
Stress and satisfaction are also negatively correlated. This is expected as students who are more stressed are less likely to be satisfied with their student life. Satisfaction is notably negativiely correlated with awareness of events. This could be possible due to the fear of missing out.
Satisfaction is most correlated with stress, awareness of events, participation, and interaction while stress, interestingly enough, is most correlated with participation, interest, and passion. This is interesting as it shows that students who are more stressed are more likely to be involved in more events. This could be because students who are more stressed are more likely to seek out more opportunities to relieve their stress. This could also be because students who are more stressed are more likely to be involved in more events. This could lead to more stress as they are busy with events.
As expected, many of the features are not correlated with each other. This is good as we do not want to have features that are soley correlated with each other. This is because it can lead to overfitting and a less accurate model.
Statistical Analysis of Variance
To find another representation of the most important features that correlate to stress and satisfaction I decided to use a statistical analysis of variance (ANOVA). This will allow us to see which features are most correlated with stress and satisfaction. I used the f_classif function from the sklearn library to calculate the ANOVA. I then ranked the features by their p-value. The lower the p-value, the more correlated the feature is with stress and satisfaction. Here are the top features for satisfaction.
Q2-How many events have you Participated in ?      1.749015e-10
Q5-What are your levels of stress ?                1.359710e-09
Housing Type                                       5.311837e-08
Nationality                                        3.758018e-06
Primary Programme                                  6.847807e-06
Department                                         1.626146e-05
Q1-How many events have you Volunteered in ?       7.285420e-04
Gender                                             7.980470e-04
Year of Study                                      8.159889e-03
Year since Matriculation                           1.581324e-02
Citizenship                                        4.267535e-02
Q4-How many activities are you Passionate about ?  9.319456e-02
Q3-How many activities are you Interested in ?     7.387781e-01
We can use this in our prediction model to see if it matches the most important features from our correlation matrix.
Prediction Model
I wanted to be able to tweak the stats for a student and find a way to maximize their satisfaction level while minimizing stress levels. To do this I used a tensorflow model running linear regression on the data.
Preprocessing
First we have to prep the data to be able to run our model. First we fill in the missing data with null values. For the categorical features I use a encoding normalization layer in order to make our strings into usable values. Computers don't read strings very well so we have to convert them into numbers. For the numerical features I use a normalization layer to scale the values between 0 and 1. This is because the values are very different and we want to make sure that they are all on the same scale. This will help our model learn better.
Model
The model is comprised of 7 layers, alternating between dense and dropout layers while decreasing the size of the dense layer, until we end with a single matrix. The dropout layers are used to prevent overfitting. The model is compiled with the adam optimizer and the mean squared error loss function.
x = layers.Dense(512, activation="relu")(all_features)
x = layers.Dropout(0.2)(x)
x = layers.Dense(256)(x)
x = layers.Dense(128, activation="relu")(x)
x = layers.Dropout(0.2)(x)
x = layers.Dense(64, activation="relu")(x)
output = layers.Dense(1)(x)
The model is trained for 10 epochs with a batch size of 32. The model is then evaluated on the test set.
Results
The model achieves a loss of 0.03 on a fresh test set. Our training ended with a 2.68 loss which is not far behind. This shows slight overfitting but nothing extreme.
Prediction
We can also use the model to predict values for one student. Specifically we can put in some of my own values and see how it predicts my stress and satisfaction levels. We can also tweak it to find the most optimal values to approach college.
# We can enter our own information here to predict values for ourselves
student_1 = {
    # ...
    "Q1-How many events have you Volunteered in ?": 1,
    "Q2-How many events have you Participated in ?": 1,
    "Q3-How many activities are you Interested in ?": 2,
    # ...
}

low_input_dict = {name: tf.convert_to_tensor([value]) for name, value in student_1.items()}
low_sample_percentage = model.predict(low_input_dict)[0][0]

print("Student 1 predicted satisfaction level", low_sample_percentage, "%") # 0.15236866 %
For this particular student we get a predicted satisfaction level of 0.15%. This is very low and shows that this student is not very satisfied with their college life. This fits with the hypothesis of the values I set up for this student, low interaction and participation. We can also use the model to find the most optimal values for a student to maximize their satisfaction and minimize their stress.
student_2 = {
    # ...
    "Q1-How many events have you Volunteered in ?": 4,
    "Q2-How many events have you Participated in ?": 4,
    "Q3-How many activities are you Interested in ?": 4,
    # ...
}

high_input_dict = {name: tf.convert_to_tensor([value]) for name, value in student_2.items()}
high_sample_percentage = model.predict(high_input_dict)[0][0]

print("Student 2 predicted satisfaction level", high_sample_percentage, "%") # 0.70740527 %
Messing around with these values we can test our hypothesis of what causes the most impact in satisfaction from the correlation matrix (ANOVA). As predicted, the more activities you participate in, the more satisfied you are typically. We can also see that the more effort you put into interacting with others, the more satisfied you are. This is a good indicator that social interaction is a key factor in satisfaction. Much of the correlation matrix is confirmed by the model.
Interpretation
With this statistical analysis and prediction model, there is a lot to takeaway. Let's go back to the original questions and see what we can answer.
1. What leads to the most optimal student college experience?
As it turns out, many of the normal college advice you hear is confirmed by this research. Participate in many activities, be outgoing, join clubs. These are all things that will lead to a more optimal college experience. Don't overdo it though, as we can see from the model, too much participation can lead to stress as well.
The data encourages you to volunteer if you can. It pushes you to live on campus (interestingly enough). Live close to home if you can. Science majors are more satisfied than arts majors, though not by much.
2. What are the most important factors in student satisfaction and stress levels?
As dictated by our ANOVA variance analysis, and confirmed by the model, the most important factors that contribute to a student's satisfaction and stress levels are:
- How many events have you Volunteered in ?
- How many events have you Participated in ?
- How many activities are you Passionate about ?
Typically the more you are actively involved in events at college, the less stressed and more satisfied you are. There are, of course, ways to go too far. When you participate in too many events, you can become stressed, as confirmed by the model. This is why it is important to find a balance between participating in events and not participating in events.
3. Can we predict student satisfaction and stress levels?
Yes, we can predict student satisfaction and stress levels with a high degree of accuracy. The model achieved a loss of 0.03 on a fresh test set. Our training ended with a 2.68 loss which is not far behind. We can use the model to give us a prediction of a student's satisfaction and stress levels based on their input. You can also use the model to find the most optimal values for yourself, and see what you can do to maximize your satisfaction and minimize your stress.
Conclusion
This project was a lot of fun to work on. I learned a lot about data analysis and machine learning and was able to put into practice some new techniques. I also learned a lot about the college experience and what makes it so great. I hope you enjoyed reading this as much as I enjoyed writing it.
Citation
if you find this analysis or code useful, please site the following:
@misc{Schaefer2022,
  author = {Schaefer, Nik},
  title = {university-ideal-life},
  year = {2022},
  publisher = {GitHub},
  journal = {GitHub repository},
  howpublished = {\url{https://github.com/NikSchaefer/university-ideal-life}},
}